Who would economists vote for?

Analysis by on September 17, 2008 at 9:04 pm

Not that I needed any more reasons to love Scott Adams, but this is truly an undertaking after my own heart.

Scott Adams recently funded his own study to see what economists really thought about the economic policies of the two presidential candidates. He introduces the study with these lines:

I found myself wishing someone would give voters useful and unbiased information about which candidate has the best plans for the economy. Then I realized that I am someone, which is both inconvenient and expensive.

The full summary is here: http://dilbert.com/dyn/ppt/Draft-report—9-3-08.ppt

The data leans towards Obama, but isn’t incredibly conclusive. The declared Democrats heavily favor Obama and the Republicans McCain. Independents leaned towards Obama. I personally find the data on how independent economists reacted to be the most interesting. On the top three issues (as determined by the economists):

  1. Education: 50% Obama, 18% McCain
  2. Health Care: 56% Obama, 25% McCain
  3. International Trade: 16% Obama, 63% McCain

Guest-Lecture at Johns Hopkins

Air Force,Analysis,Geolocation by on February 13, 2008 at 11:44 am

I guest-lectured at Johns Hopkins last Saturday in the Analysis, Data Mining & Discovery Informatics Class in the Intelligence Analysis Master’s Degree program. The students were largely early-career intelligence analysts that are accustomed to conducting one-off analysis, but rarely think about building analytic systems.

I gave an overview of IP geolocation, had the students test their skills at mapping IP addresses (thanks for the IPs Bob!), and then we discussed how we might build an analytic system to map IP addresses.

My takeaway from the class was that the government doesn’t train its people how to build systems. The analysts that I worked with had all been in their roles for a number of years, but this course seemed to be the first time that most of them had ever thought about improving the analytic system, not just improving their personal analytic capabilities

I’ve found the culture of the intelligence departments to be very analyst driven. The analyst is at the top of the food chain. Tools are built and data is collected to improve the analyst’s job.

However, analysts frequently do things that can be automated. Even worse, the agencies reinforce this by building tools that make their automatable work easier to do manually.

The key is to realize that the analysts are components of a larger system, and not the purpose of the system. We found a great balance at Quova where our analysts and algorithms worked closely together, creating a system much stronger than any one component.

Improvements in CFL Technology

Analysis by on October 15, 2007 at 6:33 pm

I didn’t ‘sign up’ for Blog Action Day, but I’m passionate about the cause and thought I’d contribute a relevant post.

I’ve been excited about Compact Fluorescent Lights (CFLs) for a while for a few reasons:

  1. CFLs save people money. Switching to CFLs is a fundamentally good economic decision
  2. Anyone can make the switch and begin using the bulbs
  3. CFLs drastically reduce energy consumption

The Energy Star program has collected a ton of interesting data over the years about CFL bulbs that they’ve certified.

I think we’re all aware about the reduction in costs for CFL bulbs over the years, but I was interested in how the technology has been improving over the years. Is it actually getting better?

I used the raw Energy star data to look at two metrics of CFL technology:

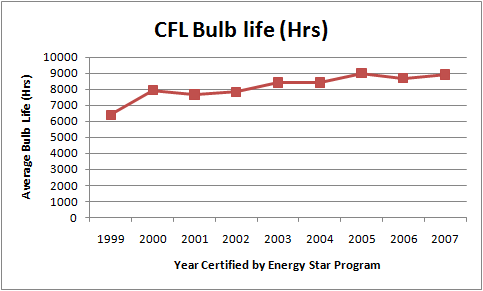
Bulb Life

cfl-bulblife.png

I took the Energy Star data and calculated the average bulb life for the bulbs approved by the Energy Star program for every year available. This does not represent a true weighted average of bulbs sold, but I think it probably provides a good representation of the direction of the technology.

All told, bulb life has increased by 38% since 1999. That’s a pretty solid improvement, especially since its been happening while prices have been plummeting.

Lumens per Watt

Lumens per Watt of CFL Bulbs

Lumens per Watt isn’t a published metric, but it is easily derived and seemed to me to be the best indicator of the true energy savings that CFL bulbs can provide. For perspective, a standard incandescent bulb provides a mere 16 Lumens per Watt.

Please note the truncated y-axis in this graph. The actual improvement from 99 to 07 is only about 9%. I hate when people do this, but the trend isn’t clear with a properly proportioned axis (where the y-intercept is at 0).

Anecdotally, I’ve seen that CFL bulbs emit a more natural light now than they did several years ago. Even though Energy Star tracks the correlated color temperature metrics for the bulbs, they don’t make that data easily downloadable.

Drawbacks of CFL technology

The primary drawback of CFLs are the limited amounts of mercury in the bulbs. Most scientists believe that they don’t pose much of a threat to people, but they do require special disposal.

What now?

Go buy some bulbs (amazon.com). It doesn’t even make economic sense to wait for your existing bulbs to burn out - replace them now! If you’re unsure which bulbs to buy, check out this great CFL bulb test conducted by Popular Mechanics.

Driving A Hummer is More Carbon-Efficient than taking a Flight

Analysis by on July 3, 2007 at 6:10 pm

Are frequent fliers worse than Hummer drivers?

I recently became disturbed by the carbon footprint of my air travel after playing around with ZeroFootprint’s carbon calculator. I had scarcely considered the impacts of my air travel and had focused much of my energy conservation efforts at home. The carbon contribution of my air travel dwarfed all other sources.

Let’s say you wanted to take your family of 4 from SF to Disney Land. You’d generate nearly twice as much carbon emissions by taking the flight than you would if you drove an 07 Hummer H3. And the contrails/emissions left by jets at high altitude are estimated to magnify the impact on global warming by as much as 2 to 4 times. All told, your impact on the environment is as high as 8x that of the road-trip in the Hummer.

A bit sensationalist? It’s not that Hummers are good for the environment, it’s just that planes aren’t that good either. Here are the numbers:

  • Unleaded gasoline generates 8.87 kg of CO2 per gallon burned. (Source: Carbonfund.org)
  • Airlines generate 0.24 kg CO2 per passenger mile for short flights (0.18 for long flights) (Carbonfund.org) times 4 for our quintessential family
  • 408 miles on the road (Google Maps), 362 miles in the air between SF and Anaheim (Webflyer)
  • 18 MPG of 2007 Hummer H3 (EPA). I also included an estimate of 10.7 MPG for the H2 in the graph below (wikipedia)

Here is what your carbon emissions would look like if you drove an Hummer or took a flight.

disney-land.png

OK, I know you’re thinking “This is silly. No way I would fly a family of 4 from SF to Disney Land. It’s only a 6 hour drive.”

How about a trip to Disney World instead? The H2 clearly sucks wind (but not by much), but the H3 still does better than the flight. If you consider the 4x factor of jet contrails, you’re better off driving the H2.

disneyworld.png

The key assumption in all of these calculations is the ‘family of 4’. But all of the Hummer drivers I see are moms shuttling their kids around. Besides, you wouldn’t really drive the 42 hours to Disney World by yourself would you? Because that would be sketchy.

Have a fun 4th!

The Statistics Behind Digg Submissions

Analysis,Digg by on June 4, 2007 at 8:51 pm

Ever since Digg announced their API, I’ve been eager to see what stats I could generate. Since my wife is out at Book Club tonight, I spent a bit of time with Digg’s API. All of the analysis below was conducted on all of the stories submitted in May:

How long does it take for stories to get promoted?

after-submission2.png

Very few stories get promoted within 2 hrs. And very few stories get promoted after 24 hours. There is definitely a window of opportunity that lasts for 24 hours after submission.

Introducing ‘Promote Rate’

Up to date, the most interesting studies done on Digg have involved basic analysis of already promoted stories. Pronet Advertising has a good look at the top 10 brands on Digg, and SEOMoz has a YouMoz article on Digg that talks about the best time to submit a story.

While both of these articles are quite interesting, I think the greatest indicator of success on Digg is something I’ve been calling ‘Promote Rate’. Basically, it is the percentage of stories of a given set of characteristics that were promoted to the first page.

Best Time of Day to Submit to Digg:

by-hour.png

Promote rates are higher on the weekends and in the evenings. A story submitted around 9PM on a weekday enjoys a 66% higher promotion rate than an 8 AM post.

Best Category to Submit to:

category.png

OK, so submitting an article to “Linux/Unix” looks to be 16x more likely to get promoted than if you submitted an article to “Business & Finance”. Certainly Diggers prefer Linux stories to the latest TPG buyout.

How much of this preference is topical vs. the category of the article? I looked at all of the stories submitted with the word ‘Linux’ in the title inside and outside the “Linux/Unix” category:

linux.png

Articles with the word ‘Linux’ in the title are promoted 9x more frequently if they are submitted in the “Linux/Unix” category.

Does having a user image matter?

user-image2.png

Users with images have more stories promoted than users without images. I would posit that a user image may indicate an active user with more friends, but submit stories without an image at your own risk =).

Anyway, that’s all for this evening. I’m looking at a few more things and will post a follow up in a little while.

Notes:

  • Be careful with causality. While I think some of the conclusions are reasonable, I haven’t always gone to the extent necessary to prove causality - we may just be seeing correlation.
  • I experienced XML errors with a small fraction of the calls to the Digg API - I didn’t try to recover these records, so the dataset is not 100% complete.
Measuring the Impact of Universal Search on Local Search Traffic

Analysis,Judy's Book by on May 24, 2007 at 11:17 pm

I expected that Google’s new Universal Search results would have an impact on Judy’s Book’s traffic. We get a decent amount of traffic from regular search, but we also get a healthy amount of traffic because our reviews are embedded in Google Local. Since most of our Google traffic is local-related and since local is one of Google’s verticals, I expected the Universal Search switch to have some impact.

The short answer is that it didn’t have a big impact on overall traffic, but it is clear that Universal Search has impacted how users interact with Google’s services. The total number of visitors remained about the same, but the source of the traffic did change slightly.

Our share of visits from Google is shown in the graph below.

universal-search2.png

Our traffic from maps.google.com doubled (from 2% to 4%), which may indicate that Universal Search is sending more traffic to Google’s maps property.

The google.com/maps referrals were mostly onebox referrals, which theoretically have gone away. You can still get there by doing an address search and clicking on the Google map or the address. Still, I don’t understand why the traffic swap would have been so smooth between the onebox results (which declined) and organic results (which grew).

Algorithms Can’t Cure All – Google Gives up Arbitrage Fight

Analysis,Search,SEM by on May 21, 2007 at 7:59 pm

I’m sure you’ve heard by now that Google has been kicking Made-For-AdSense (MFA) publishers out of AdSense. This follows multiple unsuccessful attempts to use algorithms to make the business of AdSense Arbitrage unprofitable.

First was AdSense Smart Pricing. Google intended to more closely align advertiser benefit with publisher payout (eg drop payouts to crappy, poorly converting websites). It certainly reduced payouts to MFA sites, but they continued to flourish.

Later was the AdWords Quality Score. Google introduced the AdWords Quality Score to reduce long-tail arbitrage (Arbitrageurs using millions of low cost keywords driving traffic to MFA landing pages). Quality Score is a poorly defined metric that accounts for the ‘quality’ of the relationship between the keyword, ad text and landing page. Arbitrageurs adapted and found other sources of traffic (SEO being chief among them).

So, finally after four years of automated attempts at making AdSense Arbitrage uneconomic, Google is kicking MFA-publishers out of AdSense. I’m sure they are using algorithms to identify accounts for manual review, but they’ve clearly made an important directional shift in how they think about the problem.

Avoiding the Algorithm Trap - Scalability does not require pure automation

At Quova, we initially tried to build an all-automated IP Geolocation system. In 2002 we acquired Real Mapping, a Dutch company that had taken a purely manual approach to mapping the Internet (rooms of analysts). We made the purchase to consolidate the market, however we got lucky with the technology synergies (yeah, I hate the word synergy too). Their manual approach was a great complement to Quova’s automated algorithms. By the time I left Quova in 2004 we had achieved the ideal blend: expert network geography analysts teaching an automated mapping system.

I’ve seen countless hours poured into automated solutions to intractable problems. In many cases (particularly in startups), the answer isn’t a more elegant algorithm. A lot more can be accomplished quickly if you use automation to solve 95% of the problem and manual labor to get the rest. I’ll use Excel to clean data to the point where I can manually clean the rest or we’ll outsource a project to Elance instead of trying to automate the full task.

But what about Google’s Algorithms?

Although Google is most known for their algorithmic prowess, they depend heavily on legions of people that review:

  • web sites
  • ad text
  • search results

They are even now reaching out to the web at large, asking for help in identifying things like search spam and paid links.

In many ways, Google has become a master of blending automation with manual techniques. I have to admit that I’m surprised how long it took them to acknowledge that their algorithms alone couldn’t beat the Arbitrageurs.

Buy Branded Adwords Keywords?

Analysis,SEM by on March 20, 2007 at 9:05 pm

I love good, well-thought analysis and strongly dislike half-assed, poorly drawn conclusions. I’ve found way too many examples of ‘analysis’ done where the authors didn’t do meaningful analysis, and therefore drew meaningless conclusions. Johnathan Mendez has a great analysis of whether it makes sense to buy PPC ads on your branded terms (for example, buying the search term “Amazon” if you’re Amazon.com).

His analysis indentifies two counter-intuitive conclusions about buying your branded keywords (for ecommerce sites):

  • PPC ads on your brand have no impact on traffic. You get the same traffic regardless if you buy PPC ads or not. So much for the shelf-space analogy.
  • The PPC ads raise conversion. Huh? This surprised me, but his analysis appears to be solid. He believes its a result of different searching modes. I’d also agree that makes the most sense.

His full blog post is very interesting, and worth a careful read.

Next Page »
This work is licensed under a Creative Commons Attribution-NonCommercial-ShareAlike 2.5 License. | Dave Naffziger's BlogDave & Iva Naffziger